One terminal for one question: what is moving gold right now, and does the rest of the market agree? The live price, the flows, the dollar and yields, central-bank odds and positioning, on one screen. Context for your own decisions, never a trade call.
Room
The whole picture in one look.
The live gold price and range, a plain-English read of whether price and linked markets agree, the chart with flows underneath, the Bull Meter, and what each driver is doing to gold now.
Chart · TradingView
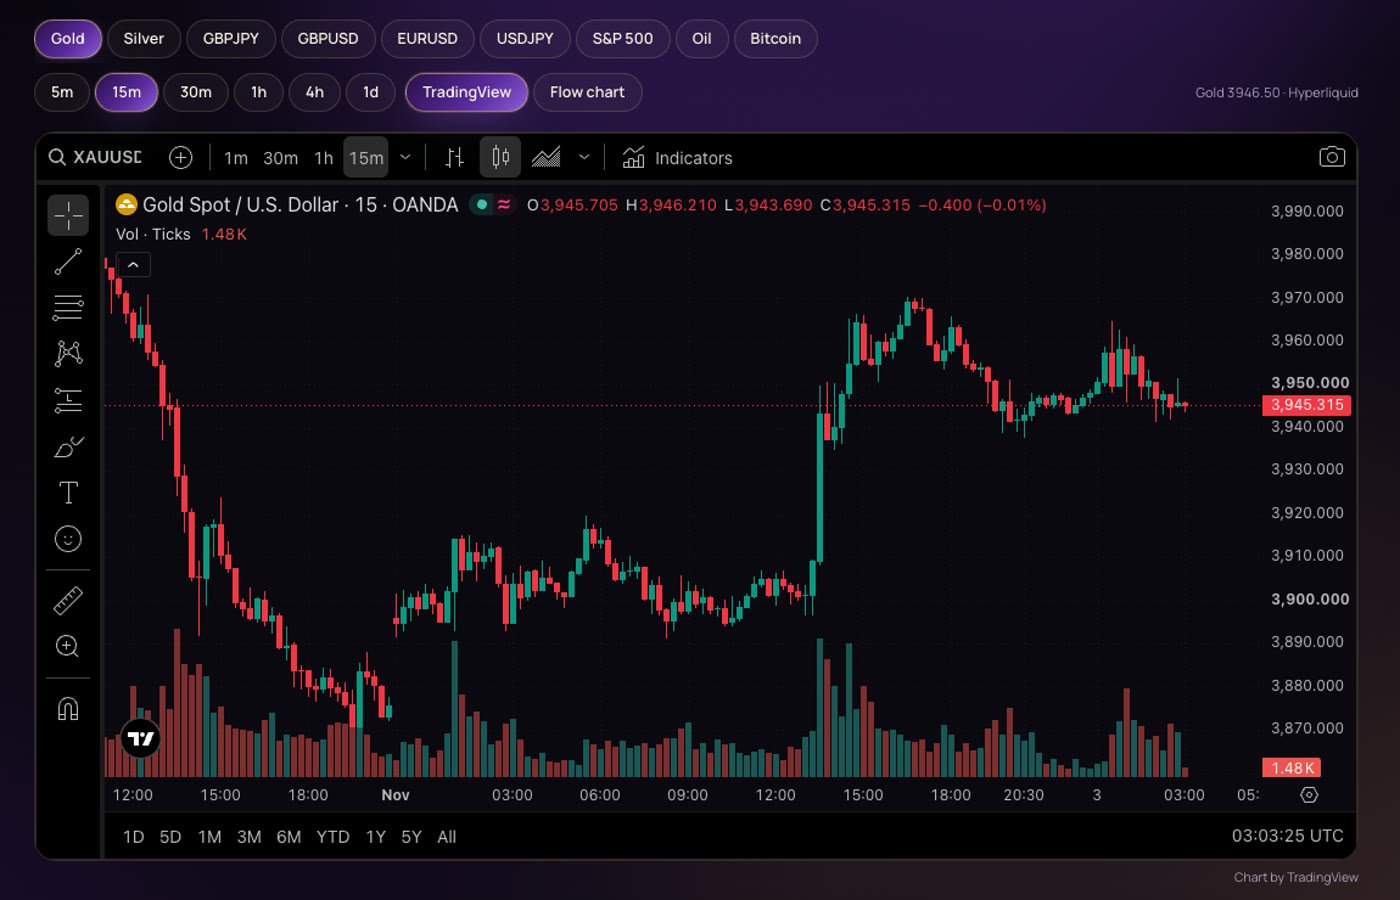
The full chart, inside the room.
Gold, silver, GBPJPY, GBPUSD, EURUSD, USDJPY, the S&P 500, oil and Bitcoin on a full TradingView chart, from the 5 minute to the daily. Draw, add indicators, switch markets without leaving.
Chart · Ω Omega
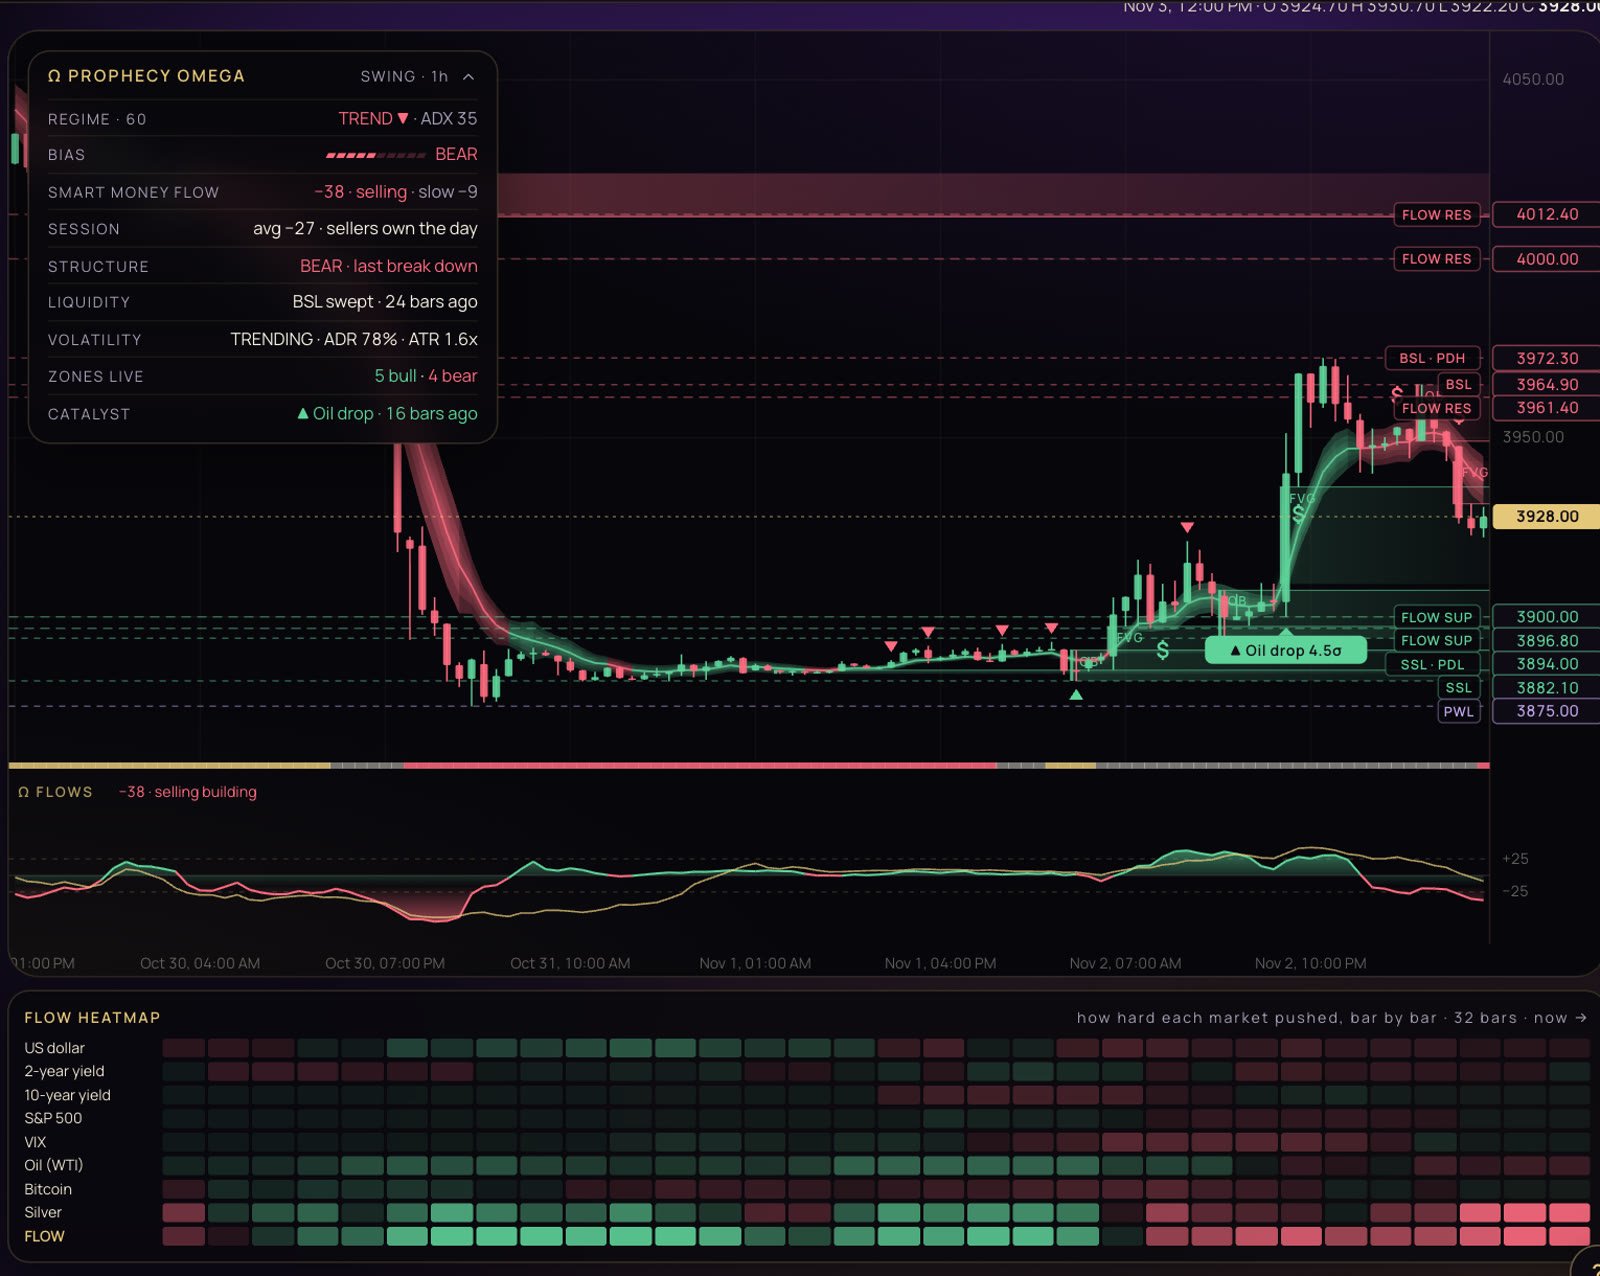
Prophecy Omega, on the candles.
Flow zones, liquidity taken, flow support and resistance, sessions, the regime and the catalysts, with a heatmap of how hard each linked market pushed, bar by bar.
Chart · Flow
See what moved it.
Each candle scored by whether the linked markets leaned for or against gold, with the headlines and big moves that landed marked on the bar where they hit.
Markets
Where money went today.
A risk gauge built from sector rotation, equities, Bitcoin, the haven bid and volatility, and every sector ranked from strongest to weakest.
Rates
The central banks, side by side.
Policy rate, inflation, real rate, the next meeting, what the market has priced and the path for the next six meetings.
Odds
What the market is betting on.
Prediction-market odds for each bank's next decision and how far they moved this week. People's bets, shown as context, not a forecast.
COT
Who is crowded, and on which side.
Weekly futures positioning for gold, silver, the pound, the yen, the dollar, the euro, oil and the S&P 500, with where it sits in its three-year range.